(Look for Updates Weekly)
NEW: Six Charts on the Value of Education and Poverty, Marriage, Income and More.
Federal Information technology is so aged, the petabytes of information may as well be available only by fax.
That government isn’t likely to update their IT anytime soon, CIVIL is providing a very modest set of graphs so the voter will have insight to the success or failure of the federal government. Spoiler alert. As you have already figured out, we spend like drunken sailors without regard to whether the dollars produce benefit to Americans.
The Economic Battle with China
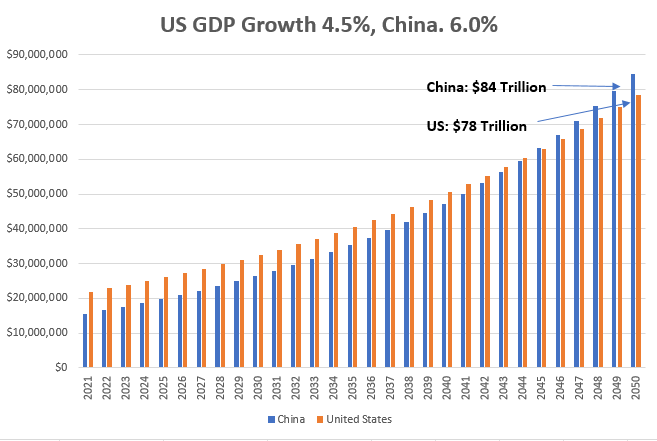
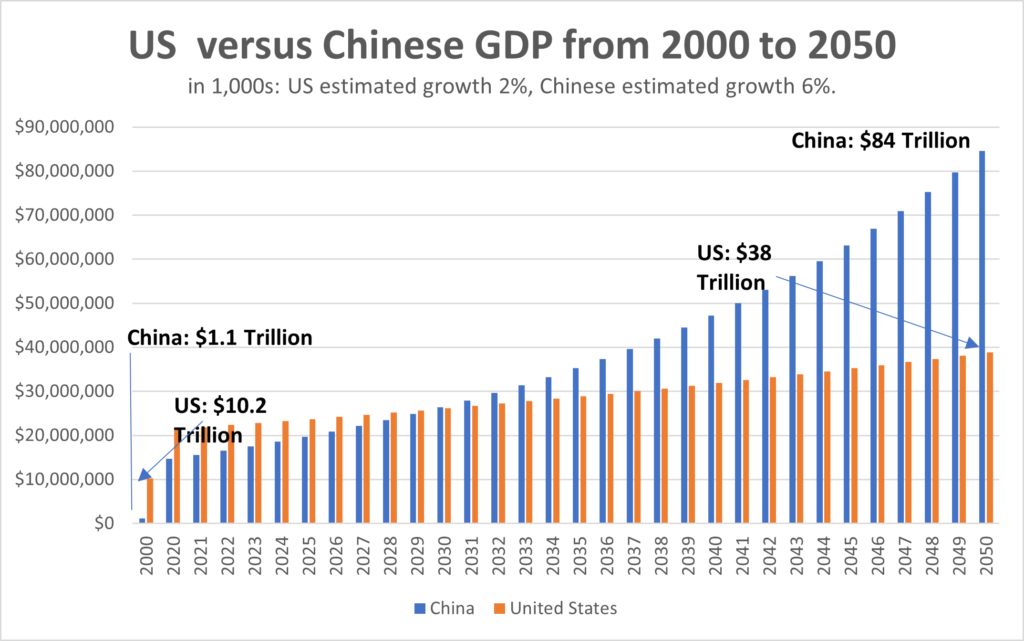
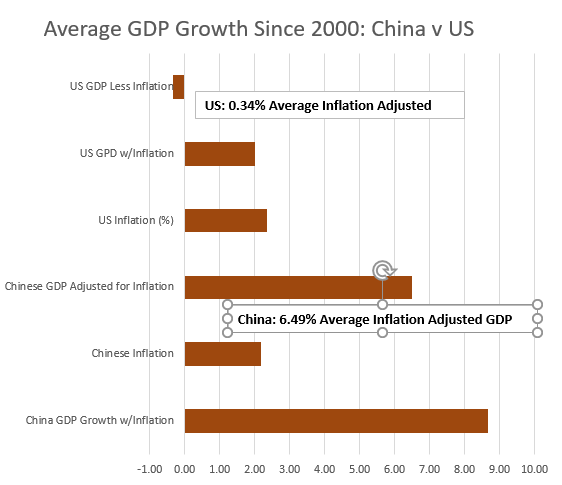
We are losing the economic battle with China. While they are growing at 6%, we are growing at 2%. To compete with China’s 1.4 billion people, America needs to grow at 4.5% consistently. CIVIL’s plan meets this goal. According to the Federal Reserve- and past data, the Republicans and Democrats, don’t have a project that increases American growth by more the 2%.
The two charts below provide insight on how we have done the last twenty years and how the view of next thirty years.
Answer: not good. America is significantly underperforming because the heavily invested programs do not provide financial or social returns. Four key underperformers are Social Security, Medicare, Education, and the War on Poverty.
The next 30 years: China grows to twice our size and will likely double US spending on the military, Belt and Road, and other efforts to marginalize the US and Europe.
The last 20 years provides no hopeful data that government is becoming smarter, simpler or wiser.
Implementing CIVIL’s ten-step platform produces economic growth of around 4.5% and keeps China at bay. Including Europe’s economic impact, the democratic, industrial nations will be about twice the size of China, holding, kicking their Communist butt to the sidelines.